Friday, July 31, 2009

Continuously variable proportional circle map


Continuously variable proportional circle maps utilize circles to create point data. The circles are in proportion to the variable being measured. This map is obviously of Canada. The circles represent the population distribution in 1980.

DOQQ


A DOQQ is used to measure true distances. It is an accurate representation of the surface. The DOQQ adjusts for topographic relief, tilt of the camera,etc. This map is of a small section of Washington, DC.

DEM

http://upload.wikimedia.org/wikipedia/en/c/cd/Oregon_DEM_relief_map.gif

A Digital Elevation Model (DEM) is a digital representation of terrain. This map was taken by the USGS of Oregon.

DLG


Digital Line Graphs result from contour lines. This map was taken from the USGS.

Thursday, July 23, 2009

DRG

http://www.goldensoftware.com/newsletter/50/Issue50Sgps5.gif
A Digital Raster Graphic (DRG) map is usually created by the USGS (US Geological Survey). This map shows a proposed hiking trip route. In this map, purple represents the start of the trip and red is the end. The green, yellow and orange show the track at the north end of the map, showing the order of the points.


Isopleths


Isopleth maps generalize and simplify data through 3-d. These types of maps are common for mapping surface elevations, rain level,etc. This map shows the rain fall for New Zealand.

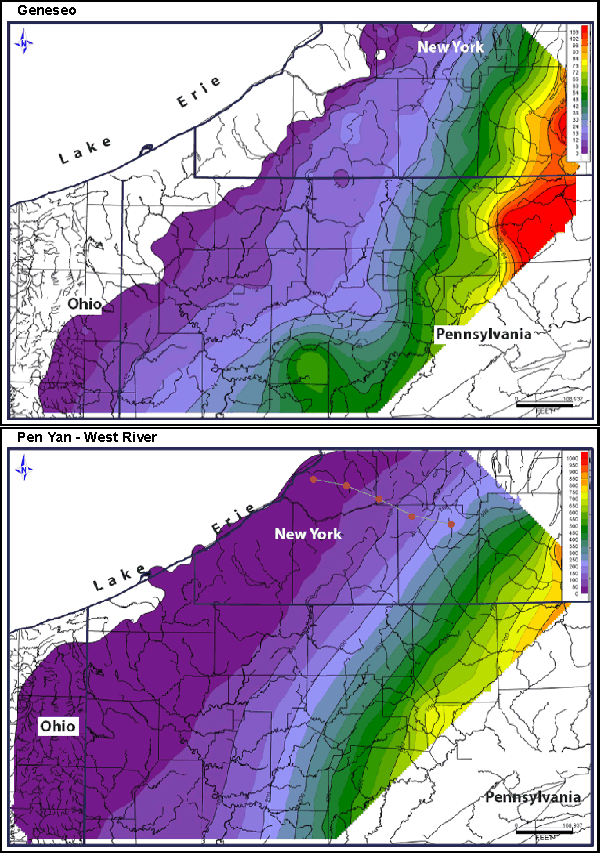
isopach

http://www.searchanddiscovery.com/documents/2007/07022lash/images/ani03.gif

Isopachs are contour lines of equal thickness. An isopach map illustrates this thickness with a stratum. This map shows Geneseo Shale (thickness is measured in feet).