Sunday, August 2, 2009

Star plots

http://upload.wikimedia.org/wikipedia/commons/3/38/Star_plot.gif


Star plots is a way of showing multivariate data in the form of a 2-D chart of 3 or more quantitative variables which are represented on axes starting from the same point.

Correlation matrix

http://yin.che.wisc.edu/images/ProteinMatrix.jpg


Correlation matrix shows the relationships between all pairs of data sets.

Similarity matrix

http://www.fxpal.com/systems/MediaAnalysis/sim10000.gif.


Similarity matrix is a matrix of scores that show the similarity between 2 data points. This is a similarity matrix of 2 photo indexes. The blue are not similar whereas the red is the most similiar.

Stem and Leaf Plot

http://www.uow.edu.au/student/attributes/statlit/modules/images/2_31.gif


Stem and Leaf Plots keeps the original data to at least 2 digits and puts said data in order. The right side is the stem and the left side is the leaves.

Box plot

http://www.statmethods.net/graphs/images/boxplot2.jpg


Box plots show groups of data through the 5 summaries: smallest observation (sample minimum); lower quartile (Q1); median (Q2), upper quartile (Q3) and largest observation (sample maximum).

Histogram

http://www.statcan.gc.ca/edu/power-pouvoir/ch9/images/histo1.gif


Histograms show frequencies shown as bars. It shows what proportion of cases falle into each of several categories. This histogram shows the number of employees to the their salary.

Parallel coordinate graph

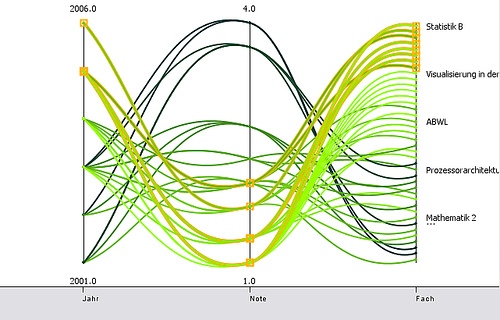
http://informationandvisualization.de/files/parallel_curves_m.jpg

Parallel coordinate graph shows multidimensional data. Using this type of graph, you are able to see trends and/or deviations.

Triangular plot

http://www.beyondveg.com/billings-t/comp-anat/chivers1992p61.gif


Triangular Plot shows the ratios of 3 variables as positions in an equilateral triangle. This plot shows the average diet for 80 primates.

Windrose

http://www.climate.washington.edu/windrose/Yakima-WindRose.jpg


Windrose is a tool used by meterologists to give a concise view of how wind speed and direction are distributed at a particular location.


Climograph

http://www.uwsp.edu/geo/faculty/ritter/images/atmosphere/climate/climographs/memphis.jpg


Climograph shows precipitation and temperature conditions for a certain place. This map shows Memphis, Tennessee. The precipitation is shown using the bar graph and the temperature is shown using the line graph.

Population profile

http://www.envcomm.act.gov.au/soe/soe2004/YassValley/Graphs/population2.gif


Population profile shows the population of people in a given location. This profile shows the rise/decline in population in 2 shires in Australia.

Scatterplot

http://www.ruraltech.org/pubs/working/ft_lewis/images/fig_02.gif


Scatterplot display values for 2 variables for a certain set of data. This scatterplot displays each point which shows the annual volume growth for a tree.


Index value plot

http://www.mathworks.com/products/demos/shipping/garch/garchcopulaevtdemo_01_thumbnail.png

An index value plot is a graph showing highs and lows that is charted on a line graph. This index value plot shows the relative daily index closings for Canada, France, Germany, Japan, UK and US from 1992 to 2004.

Lorenz curve

http://en.wikipedia.org/wiki/File:Lorenz-curve1.png


Lorenz curve shows the part of the distribution assumed by the percent of the values. It is often used to represent income distribution.

Bilateral graph


Bilateral graphs display data when both positive and negative values are shown. This graph is of the Democrat candidate approval ratings for April 2007 through January 2008. In case this is too small: dark blue is Obama; red is Edwards; yellow is Clinton; lt blue is McCain; golden is Romney.

Nominal area choropleth map


Nominal area choropleth maps shows groups without any particular order. This is a map of Greece.

Unstandardized choropleth map


Unstandardized choropleth map uses real data and not averages. This map shows the Russian population in 2001.

Standardized choropleth map

http://upload.wikimedia.org/wikipedia/commons/thumb/7/78/USA_states_population_density_map.PNG/800px-USA_states_population_density_map.PNG

This is a standardized choropleth map of the population per square mile per state.

Univariate choropleth map


Univariate choropleth maps display a single attribute such as soil type, land use; or in this case, percentage of people.

Bivariate choropleth maps

http://proceedings.esri.com/library/userconf/proc99/proceed/papers/pap171/p1712.jpg

Bivariate choropleth maps uses color to solve a problem using longitude, latitude and 2 statistical variables. This map shows the median house value in Ohio counties.

Unclassed choropleth maps


Unclassed choropleth maps assign shadings in proportion to data values so these maps don't have to classify the data.

Classed choropleth map

http://personal.uncc.edu/lagaro/2101/2101_ProjectsS2001/beefmethaneJMK.gif

Classed choropleth maps use data in order to create classes. This is a map of beef cattle emissions in North Carolina in 1992. The color shading shows tons of emissions in the various counties of North Carolina.

Range Graded Proportional Circle Map

http://www.neiu.edu/~jrthomas/377/circle.jpg


Range Graded Proportional Circle Map are used anytime you want to show relative magnitudes of phenomena. This map was created in 1990 to show the Mexican population in the western United States.