 http://upload.wikimedia.org/wikipedia/commons/3/38/Star_plot.gif
Star plots is a way of showing multivariate data in the form of a 2-D chart of 3 or more quantitative variables which are represented on axes starting from the same point.
http://upload.wikimedia.org/wikipedia/commons/3/38/Star_plot.gif
 http://yin.che.wisc.edu/images/ProteinMatrix.jpg
 http://www.fxpal.com/systems/MediaAnalysis/sim10000.gif.
 http://www.uow.edu.au/student/attributes/statlit/modules/images/2_31.gif
 http://www.statmethods.net/graphs/images/boxplot2.jpg
 http://www.statcan.gc.ca/edu/power-pouvoir/ch9/images/histo1.gif
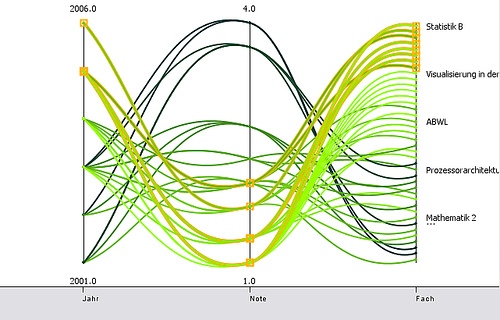 http://informationandvisualization.de/files/parallel_curves_m.jpg